What Is Trend Weight? Moving Averages for Weight Loss Explained
By The Periscope Team · · 6 min read
Trend weight is a smoothed average of your recent weigh-ins that filters out day-to-day swings from water, food and salt. A simple 7-day moving average works; exponentially smoothed trends react faster. Read the trend's slope as your weekly rate of change, and judge progress over two to four weeks, not single days.
Key takeaways
- A single weigh-in mixes fat, water, food and salt, so day-to-day changes of a pound or two usually say little about fat loss.
- A 7-day moving average is the simplest trend: add the last seven weigh-ins and divide by seven.
- Exponential smoothing weights recent days more, but a plain version runs several days behind a steady loss; lag-corrected (double) smoothing also tracks the slope to close that gap.
- The change in the trend over a week is your real weekly rate, and it is far more stable than comparing two scale readings.
- Give any trend two to four weeks before drawing conclusions, and expect it to be distorted by gaps, holidays and the first week of a new diet.
In this article
Trend weight is your weight averaged across several days, and it's a more honest number than any single weigh-in. Your weight this morning is body fat plus muscle plus a few pounds of water that come and go, plus whatever food is still in transit. Averaging lets those short-term pieces cancel out so the slow change underneath shows through.
Trend weight vs scale weight: why single weigh-ins mislead
Scale weight is one reading on one morning; the trend blends many, so it mostly follows fat and muscle rather than water and food. The things that move the scale day to day are mostly not fat. Stored carbohydrate (glycogen) is held with roughly three to four parts water, so a pasta-heavy dinner can put a pound or more on the scale by morning and take it off again two days later. Salt does something similar. In a European study of more than 1,400 people, weight rose over weekends and fell during the week by about 0.35% on average, which is around two-thirds of a pound for someone weighing 180 pounds (more on weekend weight gain). Many people see much bigger swings than that.
Meanwhile, real fat loss is slow. At a pound a week, the real change from one day to the next is about a seventh of a pound, much smaller than the noise. Comparing today with yesterday is like checking the tide by watching one wave. For a full list of what moves the number, see why your weight jumps day to day.
How does a 7-day moving average work?
Add up your last seven weigh-ins and divide by seven. Tomorrow, drop the oldest day, add the new one and do it again. That rolling version is a moving average; do it once per calendar week instead and you get a weekly weight average, which is coarser but works the same way. Each day's spike gets diluted to a seventh of its size, and the weekend-weekday rhythm averages out because every window contains one of each day of the week.
Here's a worked example with two weeks of illustrative numbers. The person behind them is losing about 1 pound a week underneath the noise.
| Day | Weigh-in (lb) | 7-day average (lb) |
|---|---|---|
| Mon | 186.4 | |
| Tue | 185.3 | |
| Wed | 186.5 | |
| Thu | 185.4 | |
| Fri | 185.5 | |
| Sat | 186.3 | |
| Sun | 185.8 | 185.9 |
| Mon | 184.6 | 185.6 |
| Tue | 185.1 | 185.6 |
| Wed | 183.9 | 185.2 |
| Thu | 184.8 | 185.1 |
| Fri | 185.0 | 185.1 |
| Sat | 185.5 | 185.0 |
| Sun | 184.6 | 184.8 |
Illustrative data, not from a real person.
Look at the raw column first. Between the first Sunday and the second Monday the scale drops 1.2 pounds. It goes up half a pound on Tuesday, drops 1.2 pounds on Wednesday, then climbs 1.6 pounds by Saturday. Read one day at a time, that's a roller coaster of good news and bad news.
The average column tells a calmer story: from the first Sunday to the second, it fell 1.1 pounds. That's close to the real rate. The second Saturday's jump to 185.5 barely registers.
You can paste your own numbers into the weight trend calculator to get the same column without the arithmetic.
What is exponentially smoothed trend weight?
It's a running average where each new weigh-in nudges the trend instead of replacing a whole window. With a smoothing factor of 0.15, for example, today's trend is 15% today's weigh-in plus 85% yesterday's trend. Yesterday's trend was itself built the same way, so older days still count, just less and less the further back they go. The NIST engineering statistics handbook describes this as weighting past observations with exponentially decreasing weights.
This has some practical advantages over a 7-day window. There's no cliff where a heavy day suddenly drops out of the average a week later. A missed day doesn't break anything, because the trend just carries on from where it was. And you can tune it: a smaller factor gives a smoother, slower line; a larger factor follows the scale more closely.
The lag problem, and how double smoothing fixes it
Any average of the past runs behind when your weight is moving steadily in one direction. If you're losing a pound a week, every number in your average is from a day when you were a bit heavier, so the trend sits above where you really are.
With a 7-day window the lag is about three days, a little under half a pound at that rate. With simple exponential smoothing at 0.15, the math works out to nearly six days behind, roughly 0.8 pounds. That's not a disaster, but the line will keep telling last week's story for a while and be slow to confirm a real change.
Double exponential smoothing (also called Holt's method or a lag-corrected trend) handles this by tracking two things instead of one. Alongside the smoothed weight, it keeps a smoothed estimate of how fast the weight is moving, the slope. Each day it projects yesterday's trend forward by that slope before blending in the new weigh-in. As the NIST handbook puts it, adding the trend term "helps to eliminate the lag." In plain words: if you've been dropping about a seventh of a pound a day, the method expects that to continue and adjusts the line accordingly, rather than always trailing.
The slope is smoothed too, usually much more heavily than the weight, so one odd morning can't swing it. The chart below uses a level factor of 0.15 and a slope factor of 0.03 on five weeks of illustrative data.
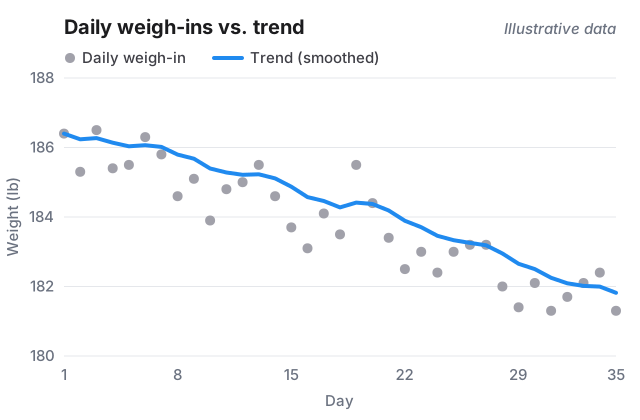
Two things stand out. The day-19 spike to 185.5 (think salty takeout the night before) barely lifts the line. And the line runs slightly above the middle of the dots. That's because the slope estimate starts at zero and, smoothed this heavily, takes weeks to learn the real rate. By day 35 the trend reads 181.8, against 182.3 for a plain exponential average of the same numbers, so the correction is working, just gradually. Heavier slope smoothing trades speed for stability.
Periscope's Reports tab uses this kind of lag-corrected moving average for its trend line, calculated per day, with missing days filled in by interpolation.
How do you read the trend as a weekly rate?
Subtract the trend value from seven days ago from today's trend value. That's your rate of change per week. For a steadier figure, take the change over four weeks and divide by four.
In the chart's data, the smoothed trend goes from about 186.0 on day 7 to about 181.8 on day 35: a fall of 4.2 pounds in four weeks, or roughly 1.05 pounds a week. The raw weigh-ins over the same days (185.8 to 181.3) would suggest 1.1 pounds a week, which happens to be close, but pick a different pair of days and you could get anything from half a pound to two pounds a week.
As a reference point, the CDC notes that people who lose weight at about 1 to 2 pounds a week are more likely to keep it off. There's more on that in realistic weight loss per week.
| What the weekly rate shows | What it usually means |
|---|---|
| Falling 0.5 to 2 lb/week for 3+ weeks | Steady loss; 1 to 2 lb/week is the pace the CDC links to keeping weight off |
| Within about ±0.3 lb/week for 3+ weeks | Weight is holding roughly steady; see plateau or water retention |
| Falling much faster in week 1 or 2 only | Often glycogen and water from a diet change, not all fat |
| Rising after a holiday or trip, then flattening | Partly water and food volume; check again in 1 to 2 weeks |
| Rising steadily for 3+ weeks | A real upward drift worth looking at |
Common pitfalls when reading your trend
A trend is only as good as the weigh-ins going into it. These are the usual ways it goes wrong.
- Changing conditions. Weighing after breakfast some days and before it on others adds noise the trend has to absorb. Same time, same scale, after the bathroom. See when to weigh yourself.
- Gaps. Smoothing can bridge a missed day or two, but long breaks leave it guessing. One study found breaks of more than a month were associated with weight gain, so gaps are also worth noticing for their own sake.
- Reading it too early. In the first one to two weeks, the trend is still settling and any diet change brings a quick water drop. Wait for three or four weeks of data before judging the rate.
- Holidays. In the same European study, weight rose about 1.35% over Christmas on average. Some of a post-holiday bump fades in a week or two; some doesn't. The trend will show you which.
- The menstrual cycle. Fluid retention tends to peak around the first day of the period. Comparing the same point across cycles is more meaningful than comparing adjacent weeks.
- Over-smoothing. A very smooth line hides noise and real changes alike. If a trend takes a month to react to anything, it's too slow to be useful.
How often you weigh in also matters: daily or near-daily weigh-ins give a smoother, more responsive trend than one reading a week. How often to weigh yourself covers the trade-offs, including when weighing less often is the better choice.
Sources
- Kreitzman SN et al. Glycogen storage: illusions of easy weight loss, excessive weight regain, and distortions in estimates of body composition. Am J Clin Nutr, 1992. https://pubmed.ncbi.nlm.nih.gov/1615908/
- Turicchi J et al. Weekly, seasonal and holiday body weight fluctuation patterns among individuals engaged in a European multi-centre behavioural weight loss maintenance intervention. PLoS One, 2020. https://pubmed.ncbi.nlm.nih.gov/32353079/
- NIST/SEMATECH e-Handbook of Statistical Methods. Single exponential smoothing. https://www.itl.nist.gov/div898/handbook/pmc/section4/pmc431.htm
- NIST/SEMATECH e-Handbook of Statistical Methods. Double exponential smoothing. https://www.itl.nist.gov/div898/handbook/pmc/section4/pmc433.htm
- Centers for Disease Control and Prevention. Losing weight. https://www.cdc.gov/healthy-weight-growth/losing-weight/index.html
- Helander EE et al. Are breaks in daily self-weighing associated with weight gain? PLoS One, 2014. https://pubmed.ncbi.nlm.nih.gov/25397613/
- White CP et al. Fluid retention over the menstrual cycle: 1-year data from the Prospective Ovulation Cohort. Obstet Gynecol Int, 2011. https://pubmed.ncbi.nlm.nih.gov/21845193/
Frequently asked questions
What is a good weight trend for weight loss?
A trend falling by about 1 to 2 pounds (roughly 0.5 to 1 kg) a week is the pace the CDC associates with keeping weight off. Slower is fine; what matters is that the trend keeps heading the right way over several weeks.
How many days of weigh-ins do I need for a trend?
A 7-day average needs a week of data to start, and any trend becomes more trustworthy after two to four weeks. Before that, the line is still settling.
Is a 7-day average or exponential smoothing better?
Either is fine for spotting direction. A 7-day average is easy to do by hand. Exponential smoothing copes better with missed days and has no sudden jumps when an odd day leaves the window, and a lag-corrected version stays closer to your real weight during steady loss.
Why is my trend weight higher than my scale weight?
When you're losing steadily, any average of past weigh-ins includes heavier days, so it sits above today's reading. It can also be above after a run of unusually light mornings, which often reverse.

Track the trend, not the noise
Periscope is a free weight tracker for iPhone with a smoothed trend line, progress photos and widgets. Your weights and photos stay on your phone.